

Sphere Points - Quick Menu
- ↳Go straight to Online Sphere-points
- ↳Download Sphere-points for Offline use
- Getting Started
- How does this work?
- Curriculum Ideas
Like all wombats I love 3D solid shapes - especially ones that challenge my front teeth! So I have put together a model for generating shapes from points that sit on the surface of a sphere.
You can put as many points as you like on the surface of a sphere, but spreading them out evenly or even symmetrically is another matter. Think about it - how do you position equidistant points on the surface of a sphere? can it be done for any number of points?
Well, the answer is of course yes for certain nice numbers, but if you just randomly decide to have say 117 points equidistant on a sphere - what does that look like? and what does a shape with 117 nearly equidistant points look like?
Getting Started
You can ↳click here to get started, or if you wish to work offline you can download the html file and unzip ↳it here.
You will need an up to date web-browser to make this work, you can use Firefox or Chrome. If going offline, unzip the download file above, unzip the file and save it somewhere on your computer. You can open the file in a browser by either 'right-click' the file and selecting open with a browser, or you can open a browser and use the file->open menu (CTRL-O). You can use the F11 key to make the page full screen (Windows and Linux).
On the top left is a 'cog' symbol  - you can click that to open your control panel.
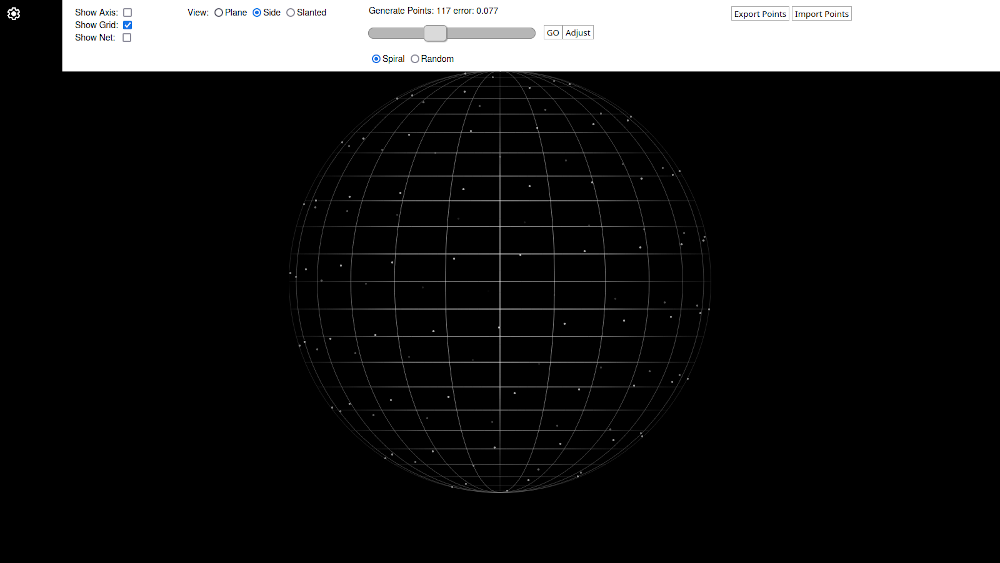
The page loads with a longitude/latitude grid for your sphere. The three most left checkbox controls allow you to turn on and off the X-Y-Z axis, the longitude/latitude grid and the net which connects the points. The latter becomes available once some points are generated.
Generate Points by moving the slider. Use the arrow keys ← and → to hone into your number. Select 'spiral' or 'random' for how you wish to initialise these. A spiral gives a very predictable initial distribution where the points are positioned equal lengths along a spiral path from the top pole to the bottom pole. Click to generate points. The error value will define the imperfection in the distribution of the points.
Adjust the points by clicking the button. The points should move to a more stable position and the error will decrease. Click as many times as required until the error is low or the points appear to have stopped moving.
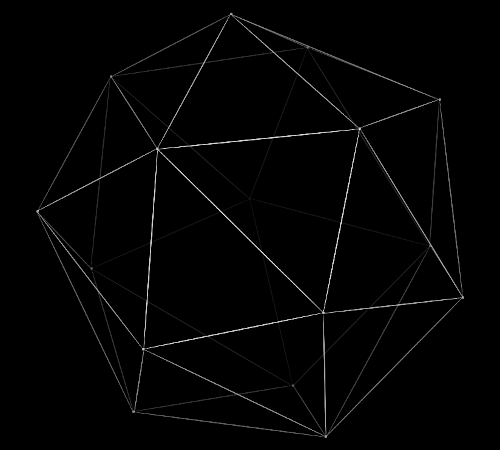
Reveal a 3D shape by ticking 'show net' on the left. Un-tick 'show grid' to get a clean view of the shape.
Re-orientate the shape by swiping/dragging the screen or selecting the three preset orientations 'plane', 'side' or 'slanted'.
Download the point data as a CSV file that can be opened in a spreadsheet program with the button.
Upload point data as a CSV file by clicking button and select a CSV file with the first two columns being the longitude and latitude respectively. (longitude between 0 and 2π, latitude between 0 and π)
How does this work?
The first step it to get some points on a sphere. The best way to get n points roughly evenly spaced over the surface of a sphere is to plot them along a spiral path from the top pole to the bottom pole. The distance between points along the spiral path should be roughly equal to the distance between the spiral adjacent coils. This method works well, but the points still have an instability error.
Regardless of whether electrons are really quantum wave functions or not, they still repel each other. If the sphere was a conducting surface which the electrons were bound to, they would try to get as far away from each other as possible. In this sense electrons are very much like wombats - yes solitary creatures that avoid other wombats. The repulsive force between electrons is defined by an inverse square law: F = q1.q2 / d2 where q1 and q2 are the charge on the particles, d is the distance and F is the repulsion force. (In the case of wombats, F might mean the smell we use to deter our neighbours!)
Using this principle, the wombat can calculate the force that each particle experiences from all other particles. If this force is only pushing the particle upwards away from the surface of the sphere, then the point is stable, because it cannot leave the sphere. However, if some of this force (a component) is pushing the particle along the surface of the sphere, (the surface component) then the point is unstable and wants to move.
To adjust the points, the wombat (with the help of your browser) calculates these forces along the surface for each point, and moves the point just a little bit in the direction it wants to go - not too much, but an amount determined by the size of the force and some clever mathematics that estimates how much this force is likely to change if we move the particle.
Obviously, each correction only brings us a little closer, so we need to repeat this process many times. Each time you click it will do 10 such corrections.
The error tells us about the instability of the points, and is an average (root mean squared) of the surface force divided by the average total force. This means that an error of say 0.05 means that the average (RMS) force on each particle is about 3° out (sin-1 0.05), ie the force on the particle is 3° from perpendicular to the surface.
Adjusting the particles normally reduces the error, but the wombat has discovered that this is not always the case! Sometimes the error increases for several adjustments before it starts diminishing - so what is happening?
There is another way of measuring the stability of the point distribution, and it relates to how efficient the particles are spaced. In classical electrostatics this is the energy of the system. The energy between two particles is no longer inverse squared, but just inverse! E = q1.q2 / 2.d This measure is not a vector, but a scalar number we can add up for each particle to particle. the smaller this number, the more efficient the arrangement.
It turns out that there might be more than one way of creating a stable distribution of points, in each case the error vanished to zero, but each of these stacking arrangements will have different energies. This is like how a ball can rest in a depression on top of a hill, and it is stable, but the ball that rolls to the bottom of the hill and rests there will have a lower potential energy.
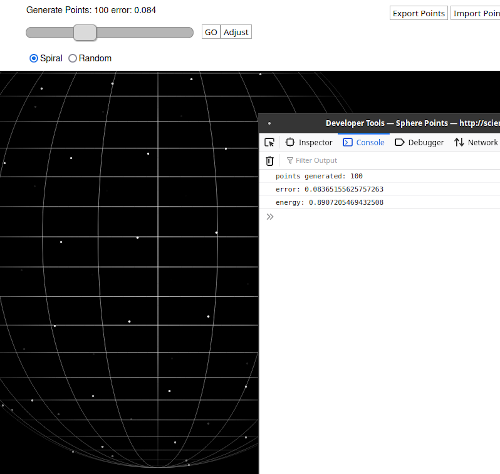
As you adjust the points, you can open the console (open the browser inspector by right click menu and choose 'inspect'), after each adjustment, the console tells you the energy of the point arrangment. Notice that even when the error might be increasing, the energy is still going down - like a ball rolling towards a steep slope!
Curriculum Ideas
Exploring Symmetries
How do you define the symmetry of a 2 dimensional shape?
Extend the concept of symmetry to 3 dimensional shapes. Create a taxonomy of symmetry, with ways of defining different types of symmetry and if possible, ways of saying what shape is more symmetric.
Create shapes beginning with the 4 point tetrahedron to as many points as time permits. Define the symmetry of the shapes you come across.
De-mystifying the Periodic Table: Over a century ago Niels Bohr developed a model of the atom based on electron shells. According to Bohr, electrons orbit in successive shells populated by fixed numbers 2n2. This means the shells can have 2, 8, 18, 32 etc electrons in their shells.
We now know that electrons behave like waves and can be imagined as a standing wave over the sphere surface of the shell.
If a harmonic wave across the surface of a sphere will produce nodes and anti-nodes, then nodes represent regions where the electrons will be most likely found.
the harmonic wave pattern must obey some sort of symmetry.
Examine the symmetry of the n2 configurations 4, 9, 16, 25 points and examine the 2n2 configurations 2, 8, 18, 32.
Do these configurations shed any light on how the harmonics of the electron shells work? Which sphere point configurations 2n2 or n2 appear to give us the best way of visualising an electron wave harmonic?
Where's my cube? Did the 8 point shape surprise you? Try some random point assignations to see if you can get a cube.
can you upload some points to make a cube and confirm it is stable? Make sure you enter data points with longitude and latitude in radians, and remember that latitude on this model begins with zero at the top and π at the bottom, so your equator is π/2 !
Start by considering what the latitude of a cube point must be if the cube is sitting flat.
Once you get your cube set up, confirm that it is stable, but open the inspector to see what the energy (efficiency) of the configuration is, and compare this to the shape the model wants to draw.
Can you find a third 8-point configuration that is also stable? (well try this one)